|
December 2000
Ohio Weather Observer Network Weather Summaries, Station Data and Around the Network E-Mail: lrhuff@megsinet.net |
|
Cold Temperatures, Snow and High Winds Headline the Weather A cold front swept across Ohio late December 11 and early December 12. It caused wind gusts in excess of 50 mph and knocked down many trees and powerlines across much of the state. Highest measured wind was in Garfield Heights (Cuyahoga County) and observed by Paul Kalal. He reported a maximum gust of 80 mph at 12:30am the 12th. Below is a listing of maximum wind gusts that were observed on early December 12 and reported to the National Weather Service/Cleveland: |
|
Time
|
City
|
County
|
Max Wind Gust
|
|
12:58 am
|
Findlay
|
Hancock
|
59 mph
|
|
1:30 am
|
Elyria
|
Lorain
|
58 mph
|
|
1:10 am
|
Mansfield
|
Richland
|
63 mph
|
|
12:30 am
|
Garfield Heights
|
Cuyahoga
|
80 mph
|
|
12:40 am
|
Akron
|
Summit
|
67 mph
|
|
12:42 am
|
Canton
|
Stark
|
72 mph
|
|
12:40 am
|
Kent State Airport
|
Portage
|
74 mph
|
|
01:53 am
|
Zanesville Airport
|
Muskingum
|
51 mph
|
|
not available
|
Newark
|
Franklin
|
56 mph
|
|
Weather Station Summaries
Ohio Weather Observer Network |
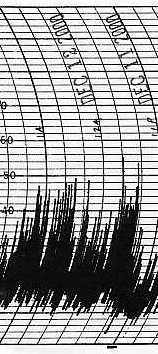
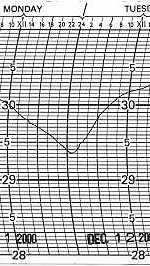
| Sandusky 1N #4 (Erie County) James Goelz Steady cold and heavy snow characterized December 2000. This was the 2nd coldest December on record (132 years) with a mean temperature of 21.6 degrees. The coldest December was in 1989 with a mean temperature of 17.2 degrees. This was also the second snowiest December in 116 years with 19.4 degrees of snowfall. December 1951 recorded 20.2 inches of snow. Winds gusted to 55 mph (see graph to the right) on the 11th at 11:38 pm. This was the highest recorded since December 15, 1987 when winds gusted to 56 mph. The barometric pressure dropped to 29.24 (sea level) which was the lowest since March 1998 (see graph below). |
| Loveland 1N #83 (Hamilton County) Bill Landry The month of December 2000 continued the trend set in November of much below normal temperatures. During December there was only two days in which the temperature for the day was above normal. Those days were the 11th and the 16th. The other 29 days registered a departure range of -1 degree to -22 degrees. It was not a bitterly cold month as there was only 2 days in which the mercury fell below zero and 5 other days in which the mercury fell below 10 degrees. The consistently below normal temperatures produced a departure from the normal of -11.1 degrees. December when combined with the period of November 10th through November 30th produced a departure from the normal of -9.73 degrees for the 52 days. Despite the consistent cold, 93.8% of the month rainfall of 3.58 inches fell as rain. The snowfall which was low at 4.0 inches, fell between the 13th and the 26th. The barometric pressure showed a wide range of 1.34 inches with a low of 29.58 on the 16h and a high of 30.92 inches on the 25th. |
| Toledo 5NE #66 (Lucas County) Mike Bielski Since I have been keeping records, this was the most snowfall ever recorded in December since 1985. Everyday was below normal but two. Continuous snow cover from December 7th through December 31st (25 days). There were 4 below zero days.
Cincinnati 5NW #13 (Hamilton County) Ronald Rothhaas After a cool summer and fall interrupted by a warm October, December was very cold and snowy, unlike any month in recent memory. December will officially go down as the third coldest in 130 years of records here, with one of the longest streaks of below freezing temperatures on record and snowfall twice normal. With an average for the month of 25.3 degrees, December's temperature here was 8.2 degrees below the official December average. Temperatures failed to top freezing on 18 of 31 days with temperatures over 40 degrees on only 6 days. While at least a trace of snow fell on 18 of 31 days, measurable snow fell on 12 days but the peak 24 hour snowfall was only 1.4 inches and the peak single event total was only 2.0 inches as no major snow systems materialized. At least 1 inch of snow was on the ground 18 of the last 19 days of the month with at least 2 inches of snow cover the last 14 days of the month. Snow depth peaked on December 30 after a 2 inch snowfall with 5 inches on the ground. In this corner of the state where Christmases are seldom white, we enjoyed our second consecutive white Christmas. I believe that on average only 1 in 10 Christmases are white in Cincinnati. Not only was Christmas white this year but the week before and the week after Christmas were white as well, adding beauty to the season and luster to the lights and decoration. For those who find snow difficult, no new snow fell on the 23rd to the 25th allowing for easy but cold travel. The low for the month was +2 degrees on Christmas morning. With so much cold, water main breaks became a real problem toward the end of the month with Cincinnati Water Works reporting 5 per day including a 24 inch main not far from here. Wooster 7N #16 (Wayne County) Jack Sisler Winter made its debut prematurely this year if you compare this December with the last two or three years. I recorded the most snowfall for this December since the December of 1995. I had 14 days with measurable snowfall plus an additional five days with trace amounts. The total liquid amount was almost 1.50 inches above normal. Temperatures were almost 9 degrees below normal. Twenty-two days had maximum temperatures of 32 degrees or less with four days below zero minimum temperatures. |
|
-
|
December 2000
|
December 1999
|
|
Mean Temperature
|
20.4
|
32.6
|
|
Zero-degree minimums
|
5
|
None
|
|
Snowfall
|
9.8 inches
|
3.2 inches
|
| Streetsboro 2N #98 (Portage County) Vance Lunn December this year was characterized by much below normal temperatures and a lot of snow. The steady cold and snow were interrupted only twice for very brief thaws. The first of these occurred on the night of the 11th and 12th. The second on the night of the 16th and 17th. Both were accompanied by steady rain. Neither spell completely melted the snowpack which has persistently laid on the ground since late November. The minimum snow depth was a trace during much of the warm ups. Measurable snow fell on 26 days during the month. Most of this was due to the lake effect as no significant wide spread storms hit this area with anything other than light amounts. The temperature, although not extreme, was steady at below normal levels. Daily highs hovered near the freezing mark, give or take a few degrees (excepting the two warm-ups already mentioned), the first half of the month. It was colder the second half with the highest temperature after the 17th at only 27 degrees.
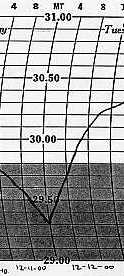
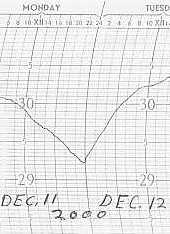
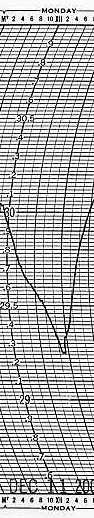
Perrysville 4W #79 (Richland County) Katie Gerwig Coldest December in recent years. Eighteen days had sub-zero wind chill readings. Thirty one days had wind chill below freezing. Snow fell on 17 days with more than one inch on the 7th, 13th and 30th. Springfield 2N #1 (Clark County) Dick Groeber The local weather conditions for the period of December 10-21, 2000 were the most drastic of the year. Sharp short periods of barometric pressure changes brought in equally short period temperature and weather changes. A barometric reading of 29.41 inches on the 10th was followed quickly by a sharp rise to 30.58 inches on the night of the 11th and 12th. This ushered in a temperature of 49 degrees on the 10th with 0.70 inch of rainfall followed quickly by a sharp drop to 18 degrees on the 13th with a period of freezing rain on the 12th and 13th with winds to 46 mph on the 12th causing some property damage. Immediately after that, another sharp pressure drop from 30.56 inches on the 15th to 29.41 inches on the night of the 16th-17th ushered in another sharp drop in temperature from the months high of 50 degrees on the 16th to a low of +6 on the 18th along with heavy rainfall totaling 1.15 inches. The barometric pressure became less intense after the 16th allowing for a period of steady cold and snow over the area. Snow fell from the 16th to the 21st totaling 4.1 inches for the period along with low temperatures below 10 degrees from the 17th on. This period marked the most number of consecutive days of measurable precipitation of the year at 9 and the coldest period since the late January cold snap earlier this year. This date snaps that long period of days of measurable precipitation. Kidron 1N #2 (Wayne County) Ronald Hahn This was the 2nd coldest December in my records with -9 degrees below normal in temperature. Only 1989 was colder in December. Snowfall was about 4 inches above normal and precipitation was almost 0.40 inch above normal. The windstorm during the night of the 11th-12th while not damaging here, was the worst in sometime. The winds resulted from a dry low which sent my new Nimbus barometer down to 29.33 inches and my barograph down to 29.23 inches. Heavy rains on the 16th sent area streams out of their banks. Spring Valley 2E #62 (Greene County) Ed Kramer The stubborn Polar Continental produced predictable conditions which was a dominate southwest wind that brought six Alberta Clippers with it's warm and moist leading edge followed by cold and wind on the back side. As compared to northern stations, a 4 inch maximum snow depth will appear minuscule. On the 25th, this station recorded a record high barometer reading of 30.79 inches with a -1 low temperature. Kent 2W #53 (Portage County) Eric Wertz December 2000 was an extremely active month weatherwise. A persistent dip in the jet stream over the eastern U.S. caused temperatures to be well below normal in Ohio. In addition, liquid equivalent precipitation was above normal and was noted on 20 days. Measurable snowfall occurred on 18 days. A total of 12 advisories/watches/warnings were issued, some of which spanned a two-day period. There were 2 fog days, 3 glaze days and one day with ice pellets noted. The ingredients were in place for a major winter storm to develop over the southern plains on December 10, 2000. Within 24 hours, this low pressure system had explosively deepened as it tracked northeast at an accelerated pace across extreme northwestern Ohio during the night of December 11. Due to a tight pressure gradient, this powerful storm system caused high winds shortly after midnight on December 12 across Ohio. High wind gusts between 12:30 am and 3:00 am reached levels not seen in some locales in more than 10 years. Winds gusted to 50 mph at Kent 2W. A precipitous fall in barometric pressure occurred as the intense low (29.30 inches) and arctic cold front approached on December 11. After the arctic frontal passage at 12:30 am on December 12 at Kent 2W, barometric pressure rose rapidly at 0,10 inch per hour during the four ensuing hours as vividly depicted in the barograph trace (see graphs below). As this potent weather system raced northeast of Ohio into Ontario, Canada on the 12th, temperatures fell rapidly from 48 degrees at 12:30 am to 28 degrees by 3:00 am and into the teens by late afternoon. Wind driven mild rains on December 11 were quickly replaced by wind driven snow early on December 12. Snowfall was not especially heavy as Ohio was in the southeast quadrant of this vigorous low pressure system. The western Great Lakes and upper midwest were not as lucky as they experienced blizzard conditions. |
|
Kent 2W Barograph 12/11-12/2000
|
|
Kidron 1N Barograph 12/11-12/2000
|
|
Munroe Falls 1SW Barograph 12/11-12/2000
|
|
Sandusky 1N Barograph 12/11-12/2000
|
|
December 2000 Ohio Weather Data
|
|
Station
|
Temperature Maximum and Minimum
|
Temperature Mean
|
Precipitation
|
Snowfall
|
High Wind Gust Date
|
Average High Wind Gust
|
|
Ada #115
|
46 (16) / -3 (25)
|
16.2
|
- / -
|
-
|
-
|
-
|
|
Akron 2E #11
|
41 (11) / 03 (22)
|
23.2
|
- / -
|
10.3 / 3.0 (6)
|
40 (12)
|
15.0
|
|
Akron-Canton NWS
|
49 (12) / -3 (23)
|
20.5
|
3.07 / 1.76 (17)
|
20.3 / 4.0 (7)
|
62 (12)
|
-
|
|
Alliance 7S #21
|
47 (11) / -1 (23)
|
21.2
|
4.15 / 1.58 (16)
|
8.8 / 2.7 (8)
|
12 (13)
|
10.4
|
|
Aurora 3S #3
|
47 (12,17) / -3 (26)
|
20.4
|
2.71 / 0.62 (16)
|
23.2 / 2.7 (31)
|
-
|
-
|
|
Barberton 4NW #100
|
49 (16) / -3 (26)
|
21.9
|
2.16 / 1.49 (16)
|
-
|
44 (12)
|
14.0
|
|
Centerville 1W #82
|
52 (16) / -3 (25)
|
22.0
|
3.07 / 1.18 (16)
|
9.0 / 2.0 (18,30)
|
43 (11,12)
|
20.0
|
|
Chillicothe 3S #40
|
54 (12) / 00 (26)
|
24.1
|
5.10 / 1.40 (19)
|
4.8 / 2.0 (31)
|
-
|
-
|
|
Cincinnati 5NW #13
|
53 (16) / 02 (25)
|
25.3
|
2.96 / 1.32 (16)
|
8.0 / 1.4 (30)
|
-
|
-
|
|
Cincinnati NWS
|
54 (16) / -3 (25)
|
23.2
|
3.18 / 1.50 (17)
|
8.5 / 1.7 (13)
|
52 (11)
|
-
|
|
Cleveland NWS
|
50 (17) / 01 (22)
|
22.3
|
2.75 / 0.76 (17)
|
21.9 / 4.0 (27)
|
56 (12)
|
-
|
|
Cleveland 7S #23
|
-
|
-
|
-
|
-
|
-
|
-
|
|
Coldwater 1NW #97
|
47 (12) / -4 (25)
|
21.9
|
1.94 / 0.79 (11)
|
16.0 / 3.0 (13,21)
|
41 (11)
|
15.1
|
|
Columbus 5NW
|
52 (11,16) / 01 (25)
|
23.2
|
3.71 / 2.22 (16)
|
11.8 / 1.6 (17)
|
-
|
-
|
|
Columbus NWS
|
52 (16) / 01 (23)
|
23.4
|
3.59 / 2.30 (17)
|
13.4 / 1.9 (17)
|
59 (12)
|
-
|
|
Dayton NWS
|
50 (16) / -3 (25)
|
20.6
|
2.41 / 0.98 (12)
|
8.0 / 1.5 (17)
|
54 (11,12)
|
-
|
|
Holgate 1SE #8
|
-
|
-
|
-
|
-
|
-
|
-
|
|
Holland #52
|
- / -4 (22)
|
-
|
2.52 / 0.20 (7)
|
19.5 / -
|
38 (5)
|
-
|
|
Kent 2E #22
|
49 (12) / -7 (26)
|
21.5
|
3.05 / 0.95 (16)
|
18.8 / 2.0 (7,13,19)
|
28 (12)
|
12.5
|
|
Kent 2W #53
|
48 (12) / -6 (26)
|
21.0
|
2.98 / 1.07 (16)
|
18.2 / 2.8 (7)
|
50 (12)
|
18.7
|
|
Kidron 1N #2
|
49 (12,16) / -5 (26)
|
21.1
|
3.18 / 1.59 (16)
|
9.9 / 2.6 (7)
|
38 (12)
|
13.0
|
|
Lagrange 2SW #87
|
47 (11,17) / -3 (26)
|
21.4
|
2.28 / 0.80 (16)
|
14.4 / 3.2 (13)
|
68 (12)
|
25.5
|
|
Lancaster 4N #17
|
55 (x) / -1 (x)
|
-
|
5.11 / -
|
-
|
51 (12)
|
-
|
|
Lancaster 1E #30
|
50 (16) / -6 (23)
|
22.7
|
4.32 / 2.31 (16)
|
10.9 / 2.2 (31)
|
-
|
-
|
|
Loveland 1N #83
|
50 (16) / -2 (23,25)
|
22.3
|
3.61 / 1.82 (16)
|
4.0 / 1.5 (18)
|
-
|
-
|
|
Mansfield NWS
|
49 (16) / -4 (23)
|
19.8
|
3.12 / 1.06 (17)
|
22.1 / 5.7 (7)
|
63 (12)
|
-
|
|
Munroe Falls 1SW #25
|
49 (12) / -2 (26)
|
21.4
|
3.15 / 0.82 (16)
|
16.7 / 2.1 (7)
|
49 (12)
|
20.9
|
|
Newcomerstown 2W #99
|
51 (16) / -4 (26)
|
22.9
|
-
|
10.6 / 2.0 (19,30)
|
50 (12)
|
15.9
|
|
Newcomerstown 1S #106
|
52 (16) / -5 (26)
|
22.5
|
1.79 / 1.09 (16)
|
13.5 / 3.0 (7)
|
52 (12)
|
18.6
|
|
New Philadelphia 1NW #58
|
50 (16) / -4 (26)
|
21.1
|
3.11 / 1.20 (16)
|
8.1 / 2.0 (7)
|
E80 (12)
|
-
|
|
North Ridgeville 1N #32
|
50 (16) / 01 (22,23,26)
|
23.1
|
2.30 / -
|
14.9 / 3.0 (7)
|
46 (12)
|
19.4
|
|
Ottawa 4E #15
|
46 (11,12) / -8 (28)
|
19.1
|
2.60 / 1.10 (11)
|
14.6 / 3.0 (7)
|
60 (12)
|
25.7
|
|
Oxford #108
|
-
|
-
|
-
|
-
|
-
|
-
|
|
Perry 3SE #38
|
47 (16) / 02 (22)
|
23.0
|
4.28 / 0.56 (7)
|
41.5 / 7.0 (27)
|
-
|
-
|
|
Perrysville 4W #79
|
49 (16,17) / -5 (26)
|
21.6
|
3.63 / 1.66 (14)
|
12.6 / 3.8 (7)
|
49 (12)
|
16.4
|
|
Port Clinton 3W #14
|
46 (16) / 01 (22)
|
21.4
|
2.69 / 0.85 (12)
|
18.4 / 6.9 (14)
|
64 (12)
|
27.4
|
|
Ravenna 1E #101
|
46 (12) / 01 (23)
|
24.1
|
4.52 / 0.63 (17)
|
20.8 / 3.8 (14)
|
63 (12)
|
17.0
|
|
Rockbridge 4W #33
|
51 (16) / -3 (23)
|
22.7
|
4.23 / 2.49 (17)
|
13.3 / 2.3 (19)
|
-
|
-
|
|
Rocky River 1W #51
|
-
|
-
|
2.52 / 0.55 (11)
|
18.5 / 4.5 (13)
|
-
|
-
|
|
Sabina #113
|
-
|
-
|
3.35 / 2.35 (16)
|
-
|
-
|
-
|
|
Sandusky 1N #4
|
49 (11,16) / 01 (22)
|
21.6
|
2.59 / 0.63 (11)
|
19.4 / 6.1 (13,19)
|
55 (11)
|
24.6
|
|
Sharonville 2NE #43
|
53 (x) / 00 (x)
|
24.3
|
3.74 / 1.78 (x)
|
7.3 / 1.4 (x)
|
43 (11)
|
-
|
|
Springfield 2N #1
|
50 (16) / -2 (25)
|
22.9
|
2.80 / 1.07 (16)
|
10.0 / 1.5 (21)
|
46 (12)
|
21.0
|
|
Spring Valley 2E #62
|
52 (16) / -1 (25)
|
23.0
|
2.85 / 0.74 (16)
|
8.5 / 2.0 (31)
|
22 (11)
|
11.2
|
|
Stow 1SE #105
|
49 (12,17) / 04 (22,23,26)
|
25.7
|
2.90 / 0.67 (16)
|
16.3 / 2.5 (31)
|
-
|
-
|
|
Streetsboro 2N #98
|
49 (12) / -4 (26)
|
21.7
|
3.23 / 1.18 (16)
|
28.5 / 3.1 (7)
|
41 (12)
|
17.1
|
|
Sugarcreek 2SW #112
|
51 (12) / -6 (26)
|
21.9
|
2.45 / 1.39 (16)
|
10.5 / 3.0 (7)
|
49 (12)
|
18.0
|
|
Toledo 5NE #66
|
43 (16) / -4 (22)
|
18.9
|
3.98 / 1.37 (11)
|
27.4 / 5.6 (7)
|
40 (17)
|
-
|
|
Toledo NWS
|
42 (16) / -7 (25)
|
18.3
|
3.33 / 1.06 (11)
|
26.0 / 5.1 (13)
|
40 (17)
|
-
|
|
Wooster 7N #16
|
49 (16) / -6 (28)
|
20.4
|
3.80 / 1.68 (16)
|
9.8 / 2.2 (28)
|
58 (12)
|
17.8
|
|
Youngstown NWS
|
49 (12) / 02 (22)
|
21.8
|
3.22 / 1.29 (17)
|
19.5 / 2.3 (19)
|
60 (12)
|
-
|
|
Zanesville 6N #48
|
50 (16) / -1 (23)
|
23.2
|
3.45 / 1.86 (16)
|
8.5 / 2.0 (7,18,21)
|
40 (12)
|
-
|
|
Around the Network
|
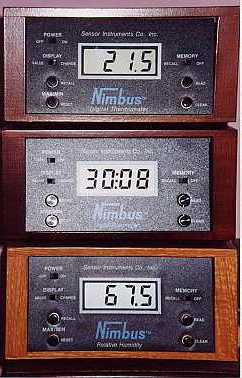
| Kidron Observer Ron Hahn added a new instrument to his station this past September. Pictured to the right is his bank of Nimbus Instruments by the Sensor Instrument Company. On top is the digital temperature unit, in the middle is Ron's new digital barometer and on the bottom is the digital relative humidity unit. Ron says that he is very pleased with his new barometer and is now using this unit for recording his station's air pressure readings. Previously he had used his Winchester barograph as his primary instrument for air pressure.
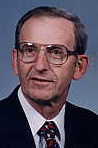
OWON observers celebrating December weather station anniversaries are: Martin Mortus at Port Clinton 3W started December 21, 1973 and Don Diller began December 9, 1998 at Coldwater 1NW. Our hats are off to both of these faithful observers. |

|
Martin Mortus
|
|
Don Diller
|
| End of the December 2000 Ohio Weather Summaries |